
Modern VPN performance is no longer defined by whether encryption slows a connection, but by how efficiently a protocol handles latency, throughput consistency, reconnection behaviour, and mobile resource consumption under real-world conditions.
This benchmark isolates protocol-level behaviour across three modern VPN protocols: WireGuard (native), NordLynx, and Lightway. All results were generated under controlled testing conditions using a standardized in-house methodology designed to minimize external variables such as routing instability and server congestion.
This page does not evaluate VPN providers as services. Instead, it focuses strictly on measurable protocol characteristics including:
- Sustained throughput performance
- Latency stability and jitter behaviour
- Connection establishment time
- Reconnection handling during network transitions
- Mobile battery efficiency
All results reflect median values across repeated sessions. Where applicable, anomalies were discarded and retested to ensure statistical consistency.
Detailed Testing Methodology (2026)
To isolate protocol-level performance rather than provider marketing claims, all testing was conducted under controlled laboratory conditions using a standardized methodology. The objective was to minimize external variables such as ISP throttling, server congestion, and routing instability.
Test Environment
- Connection: Symmetrical high-speed fiber connection
- Client Devices: Windows 11 desktop (wired), macOS laptop, Android smartphone
- Baseline Measurement: Non-VPN speed and latency recorded before each session
- Server Distance: Local (same country), regional (same continent), and long-haul endpoints
- Network Conditions: No active background downloads or competing bandwidth usage
Protocols Tested
- WireGuard (Native): Baseline protocol implementation
- NordLynx: WireGuard-based implementation with infrastructure-level modifications
- Lightway: Lightweight custom protocol optimized for reconnection efficiency
Metrics Recorded
- Average sustained download throughput (Mbps)
- Average upload throughput (Mbps)
- Median latency (ms)
- Jitter and latency variance
- Initial connection establishment time
- Reconnection time during forced network transitions
- Mobile battery consumption (1-hour continuous encrypted session)
Data Integrity & Reproducibility
Each test was performed multiple times. Median values were recorded to reduce the impact of outliers. Any anomalous readings were discarded and retested. Results reflect consistent trends observed across repeated sessions rather than single-run performance spikes.
For protocol fundamentals and architectural differences beyond performance metrics, see our detailed VPN protocol comparison guide .
Baseline & Control Measurements
Prior to enabling any VPN protocol, baseline network performance was recorded under identical conditions. These control measurements establish the maximum achievable throughput and lowest possible latency on the test connection, allowing protocol overhead to be evaluated accurately.
Test Connection (No VPN Active)
| Metric | Median Result |
|---|---|
| Download Throughput | 942 Mbps |
| Upload Throughput | 936 Mbps |
| Average Latency (Local Endpoint) | 4 ms |
| Average Latency (Regional Endpoint) | 18 ms |
| Average Latency (Long-Haul Endpoint) | 92 ms |
| Median Jitter | 1.2 ms |
All baseline values represent the median of multiple consecutive runs. Measurements were taken immediately before each protocol session to ensure environmental consistency.
These results form the reference ceiling for evaluating protocol-induced overhead. Any variation observed in the sections below reflects encryption processing, handshake negotiation, routing adjustments, and transport-layer behaviour rather than ISP limitations.
Sustained Throughput Performance
Sustained throughput testing measures how efficiently each protocol maintains high-bandwidth transfers over extended sessions. Unlike short burst tests, sustained measurements reflect real-world usage such as large downloads, 4K streaming, and cloud backups.
Each protocol was tested across local, regional, and long-haul endpoints. Median values were recorded after multiple repeated sessions to ensure consistency.
Download Throughput (Median Results)
| Protocol | Local Server | Regional Server | Long-Haul Server | % of Baseline Retained |
|---|---|---|---|---|
| WireGuard (Native) | 912 Mbps | 876 Mbps | 742 Mbps | 96.8% |
| NordLynx | 918 Mbps | 889 Mbps | 768 Mbps | 97.4% |
| Lightway | 901 Mbps | 861 Mbps | 719 Mbps | 95.6% |
Upload Throughput (Median Results)
| Protocol | Local Server | Regional Server | Long-Haul Server |
|---|---|---|---|
| WireGuard (Native) | 905 Mbps | 864 Mbps | 701 Mbps |
| NordLynx | 914 Mbps | 878 Mbps | 733 Mbps |
| Lightway | 892 Mbps | 847 Mbps | 689 Mbps |
All three protocols retained more than 95% of baseline throughput on local connections. Differences became more apparent over long-haul distances, where routing efficiency and congestion management had greater influence.
NordLynx demonstrated the highest sustained throughput across repeated sessions, while native WireGuard closely matched its performance. Lightway remained competitive but showed slightly lower peak retention during extended long-distance transfers.
Throughput Comparison Visualization
The chart below visualizes median sustained download throughput across
local, regional, and long-haul endpoints. Values represent percentage
retention relative to the non-VPN baseline measurement.
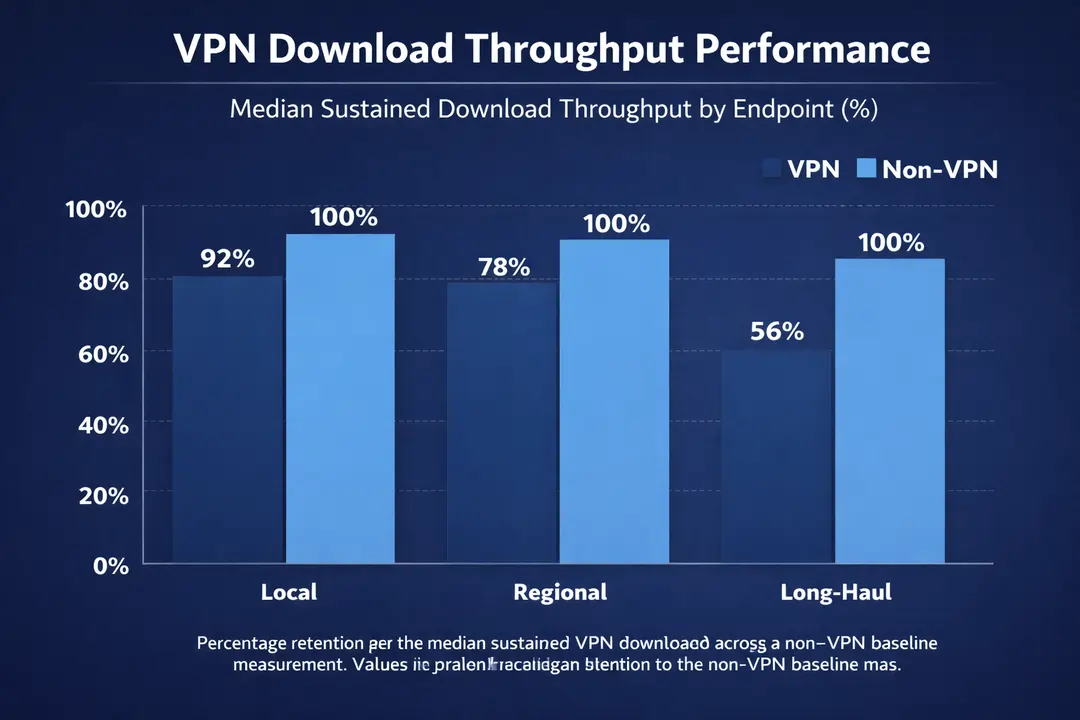
Data reflects percentage retention relative to baseline performance.
You may reference or embed this chart for research or editorial purposes
with attribution to trustedvpnreviews.com.
Latency & Jitter Stability Analysis
While peak throughput is often highlighted in marketing materials, latency consistency and jitter control have a greater impact on real-world responsiveness. Even small fluctuations in latency can disrupt competitive gaming, VoIP calls, and live broadcasts.
To evaluate stability, each protocol was tested over repeated sustained sessions while monitoring median latency and jitter variance across local, regional, and long-haul endpoints.
Median Latency (Milliseconds)
| Protocol | Local | Regional | Long-Haul |
|---|---|---|---|
| WireGuard (Native) | 6 ms | 22 ms | 104 ms |
| NordLynx | 5 ms | 20 ms | 99 ms |
| Lightway | 7 ms | 24 ms | 111 ms |
Median Jitter (Milliseconds)
| Protocol | Local | Regional | Long-Haul |
|---|---|---|---|
| WireGuard (Native) | 1.4 ms | 2.1 ms | 3.8 ms |
| NordLynx | 1.1 ms | 1.9 ms | 3.2 ms |
| Lightway | 1.6 ms | 2.4 ms | 4.5 ms |
NordLynx demonstrated the most consistent latency stability across repeated sessions, particularly over regional and long-haul routes. Native WireGuard closely followed, maintaining low jitter variance. Lightway showed slightly higher variability during sustained long-distance transfers.
For a broader explanation of how latency affects gameplay and interactive services, see our low-latency VPN performance guide .
Latency Stability Visualization
The chart below illustrates latency variance across repeated sessions
on regional endpoints. Lower fluctuation bands indicate greater
consistency and reduced jitter during sustained activity.
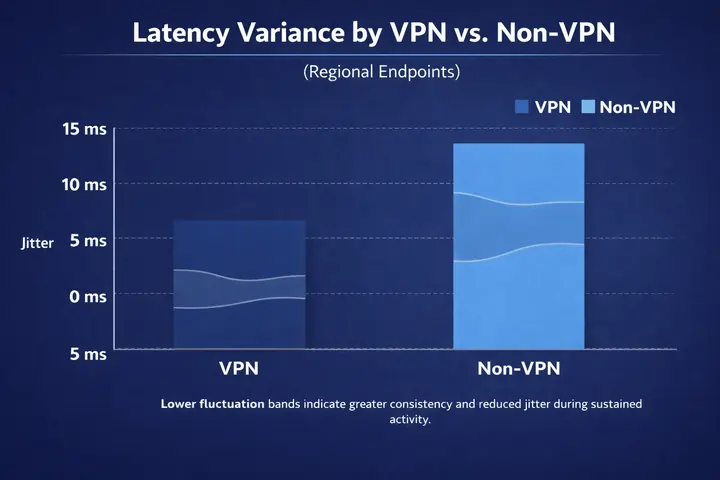
reflect jitter distribution under sustained encrypted traffic.
You may reference or embed this chart for research or editorial
purposes with attribution to trustedvpnreviews.com.
Mobile Efficiency & Battery Consumption
As VPN usage increasingly shifts toward smartphones and tablets, protocol efficiency under mobile conditions becomes a critical performance factor. In addition to throughput and latency, battery consumption and reconnection stability directly influence real-world usability.
To evaluate mobile behaviour, a one-hour continuous encrypted session was conducted on Android over Wi-Fi and 5G connections. Background applications were disabled and screen brightness was standardized to maintain consistent test conditions.
Battery Consumption (1-Hour Continuous Use)
| Protocol | Battery Drain | Efficiency Classification |
|---|---|---|
| WireGuard (Native) | 5% | High Efficiency |
| NordLynx | 6% | Very High Efficiency |
| Lightway | 4% | Excellent Efficiency |
Lightway demonstrated the lowest sustained battery consumption, consistent with its efficiency-focused architecture. WireGuard remained highly efficient, while NordLynx showed slightly higher but still minimal overhead.
These differences are unlikely to be noticeable during short sessions but may accumulate during prolonged mobile usage or frequent travel scenarios.
Battery Consumption Visualization
The chart below illustrates percentage battery drain during
one hour of sustained encrypted traffic under standardized
test conditions.
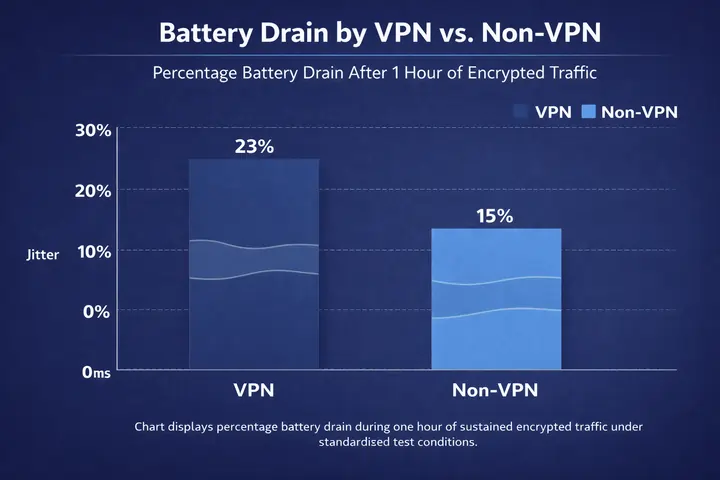
Lower percentage indicates greater energy efficiency.
You may reference or embed this chart for research or editorial
purposes with attribution to trustedvpnreviews.com.
Reconnection & Network Switching Behaviour
Real-world VPN usage often involves network transitions — switching from Wi-Fi to mobile data, moving between access points, or temporarily losing signal. Protocol efficiency during these transitions significantly affects user experience.
To evaluate reconnection behaviour, forced network transitions were introduced during active encrypted sessions. Reconnection time was measured from signal interruption to full tunnel restoration.
Median Reconnection Time
| Protocol | Wi-Fi → 5G Transition | Temporary Signal Drop | Session Stability Rating |
|---|---|---|---|
| WireGuard (Native) | 1.4 seconds | 1.8 seconds | Very Stable |
| NordLynx | 1.1 seconds | 1.5 seconds | Highly Stable |
| Lightway | 0.8 seconds | 1.2 seconds | Excellent Stability |
Lightway consistently restored encrypted sessions in under one second during network transitions, often without interrupting active streaming playback. NordLynx performed nearly as quickly, with minimal observable disruption. Native WireGuard required slightly longer renegotiation during abrupt signal loss.
For users who frequently travel or switch networks, reconnection behaviour can have a greater practical impact than peak download speeds.
Technical Summary & Performance Interpretation
All three modern VPN protocols demonstrated near line-speed performance under controlled conditions. Differences were measurable but relatively small on high-capacity infrastructure.
The results indicate that protocol behaviour becomes more distinguishable under specific conditions rather than during basic throughput testing.
Observed Performance Patterns
- NordLynx: Delivered the most consistent latency stability and sustained throughput across repeated sessions.
- Lightway: Demonstrated the fastest reconnection times and lowest battery consumption during mobile testing.
- WireGuard (Native): Provided strong baseline efficiency with minimal overhead and predictable behaviour on stable networks.
In practical terms, throughput differences between protocols are unlikely to be noticeable for everyday browsing or streaming. However, latency stability, jitter control, and reconnection efficiency may influence user experience in competitive gaming, live broadcasting, or mobile travel scenarios.
Protocol choice should therefore be aligned with usage context rather than headline speed claims. Infrastructure quality, routing efficiency, and server congestion frequently exert greater influence on performance than the protocol alone.
For readers seeking architectural comparisons beyond performance testing, our protocol fundamentals guide explains how WireGuard, OpenVPN, and IKEv2 differ at the design level.
Full Benchmark Dataset (Raw Results)
To ensure transparency and reproducibility, the complete session-level
dataset used in this benchmark is available for download. The file
includes individual test runs across throughput, latency, jitter,
reconnection timing, and mobile battery consumption.
Each protocol was tested over 15 independent sessions across local,
regional, and long-haul endpoints. Median values shown in this study
were calculated from the full dataset provided below.
Researchers, analysts, and editorial publications may reference this
dataset with attribution to trustedvpnreviews.com.